Top 6 CDN Observability Platforms to Monitor Performance and Incidents
CDN observability platforms give real-time visibility into traffic, routes, and logs, helping you spot and fix issues before users do.

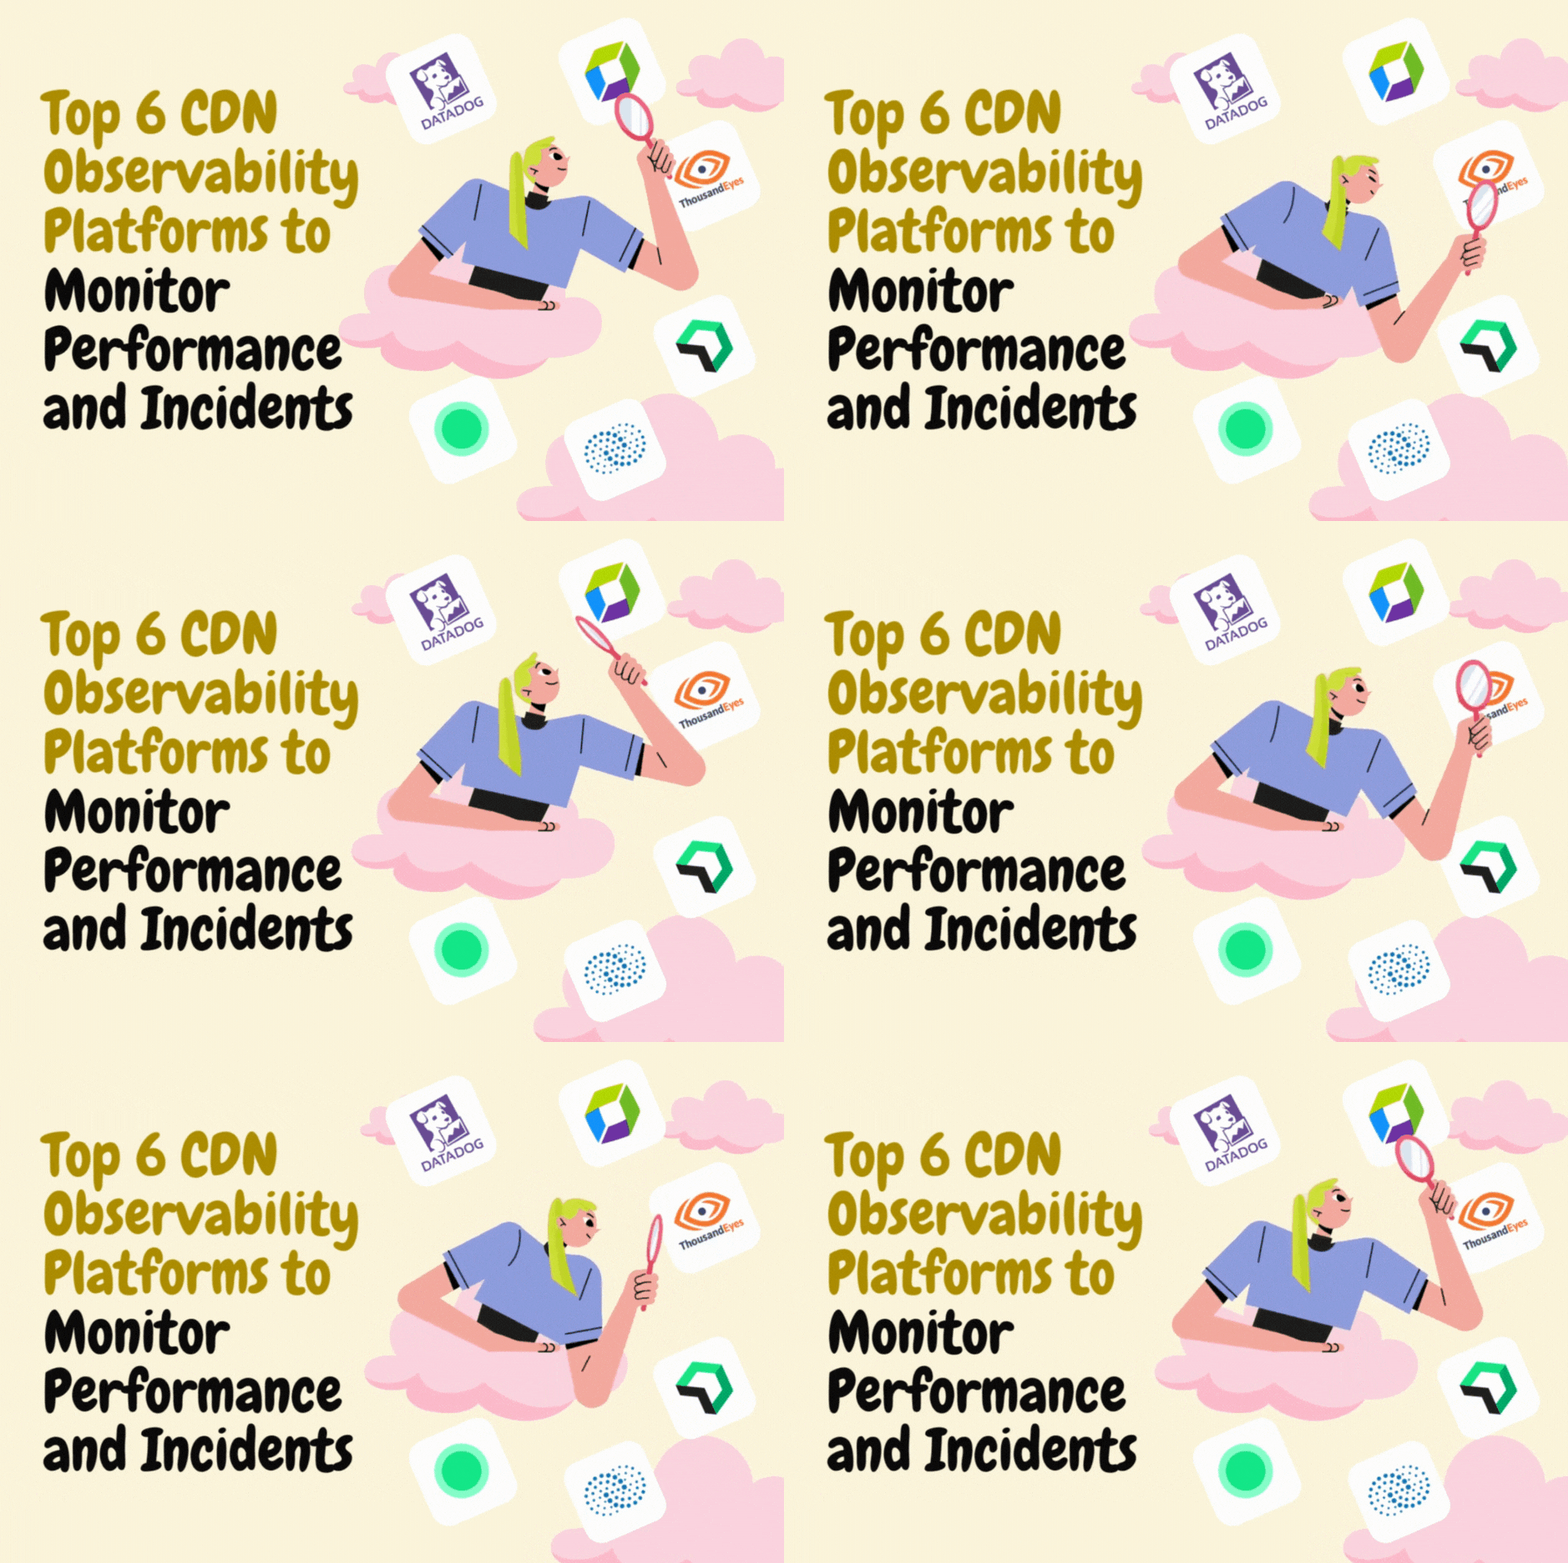
The internet is just like a busy city at night. Lights everywhere, traffic streaming, side streets opening onto highways. When your site slows down, you feel like a driver stuck at a green light that never turns. You need a way to climb above the streets and actually see the flow.
That is what strong CDN observability platforms give you. They help you watch the middle of the way, not just the origin and the browser. You get live signals from synthetic tests, real users, network routes, and raw logs, so you can fix issues before your customers even notice.
Key Takeaways
- CDN monitoring works best when it combines edge logs, synthetic monitoring, real user data, DNS signals, and network visibility.
- Edge observability shows what happens between the origin and the user, where standard app dashboards often lose context.
- Datadog, Dynatrace, and New Relic are strongest when CDN signals need to connect with application performance monitoring.
- Catchpoint and ThousandEyes are better when you need outside-in proof for ISP, DNS, BGP, or multi-CDN incidents.
- Coralogix is useful when high-volume CDN logs make cost control a major concern.
How to Think About CDN Observability
A CDN sits across hundreds of points of presence. A tiny routing change in one region can ripple into slow pages and broken media. You cannot fix what you cannot see, so you need data that covers both your app and the internet in between. That is the beating heart of good data observability tools for delivery at the edge.
When people say data observability platforms, they often mean tools that track metrics, logs, and traces across apps and infra. For CDNs you still want those, but you also care a lot about the path across networks, the health of DNS, and how traffic lands on the right edge.
In short, you want inside out and outside in views at the same time.
{{promo}}
What to Look For in a CDN Observability Platform?
Use this short checklist to lower risk and shorten your mean time to resolve:
- Coverage across four pillars: synthetic tests, real user monitoring, CDN log analysis, and network path insight.
- Correlation that ties a slow edge to a slow service, not just yet another chart.
- Cost control so you can keep every vital signal without wasting budget on noise.
- Actionable alerts that wake the right person, with the right context, only when needed.
- Vendor neutral vantage points to validate what your CDN and your ISP say during an incident.
- Simple workflows your on call team can use at 2 a.m. without digging through ten dashboards.
You will notice the list above blends the language of CDN observability platforms with the language used for the best data observability tools.
That is on purpose. Your users do not care where the slowness lives. All they care about is that you find it fast.
The Top 6 CDN Observability Platforms
Below you will find six entries that are extremely famous for being reliable in the CDN world. You need to find what matches your use case, and lock it in:
1. Datadog
Datadog feels like a control room where every dial on your stack sits within reach. If you already measure apps, infra, and security in one place, adding CDN signals here keeps your team in a single flow. That convenience pays off during incidents when seconds feel heavy.
You will like how easy it is to plug in logs from major CDNs and turn them into metrics you can chart and alert. Pair that with browser monitoring and synthetic tests, and you can track the path a visitor takes like a runner on a lit track.
Features
- Integrations for popular CDNs plus origin, DNS, and WAF
- Real user monitoring for web and mobile, with session replay options
- Global synthetic tests for uptime, APIs, and user flows
- Log pipelines to parse, enrich, and control ingestion
- Tag based alerting that routes to the right team fast
- Correlation across app, infra, security, and edge in one view
Commonly used by: SaaS, fintech, gaming, retail
Pricing note: Datadog is modular, so plan costs across logs, APM, RUM, synthetic tests, and network checks instead of treating CDN monitoring as one flat line item.
2. Dynatrace
Dynatrace feels like a guide who not only shows you the map but also points to the exact pothole. Its causation focused AI helps you jump from symptoms to what broke and where. When your world is large and fast changing, that answer first style saves time.
You get full web and mobile user data without sampling, plus synthetic tests from many regions. That makes it easier to prove if the pain sits at the edge, within your code, or in a backend service only one region hits.
Features
- Automatic discovery of services and real time dependency maps
- Real user monitoring with rich user journey metrics
- Global synthetic tests for transactions and APIs
- Centralized log analytics that can ingest CDN and WAF events
- AI driven problem detection with root cause suggestions
- Built in collaboration for incidents and reports
Commonly used by: large enterprises, banks, telecom, public sector
Pricing note: Dynatrace uses usage-based pricing across real user monitoring sessions and synthetic actions, so model expected sessions, test frequency, and retention before rollout.
3. New Relic
New Relic speaks the language of developers. If your teams own both code and delivery, the quickstarts for major CDNs get you from zero to value in a short time. You plug in log streams, load prebuilt dashboards, and watch the edge like you watch your services.
It pairs cleanly with browser monitoring and synthetics. That mix helps you connect a falling cache hit ratio with a jump in 4xx or 5xx errors, then tie the final impact to user waits and route changes.
Features
- Quickstarts for Cloudflare, Akamai, Fastly, and Azure CDN
- Browser monitoring with performance insights and errors
- Synthetic checks for uptime and simple scripted flows
- Flexible alerts that tie to Slack or PagerDuty
- Unified query language for metrics, events, logs, traces
- Clear pricing structure with a generous free tier for trials
Commonly used by: startups, digital media, SaaS, marketplaces
Pricing note: New Relic is easy to trial because it includes free monthly data ingest, but heavy CDN logs can move costs into paid data tiers quickly.
4. Catchpoint
Think of thousands of independent vantage points as a network of watchtowers. When a route or a point of presence acts up in a region, you see it early and with proof.
It shines for multi CDN setups and SLA validation. You can run comparisons across providers, simulate failover, and verify that users are mapped to the right edge.
During tense vendor calls, third party data is your compass.
Features
- Very large global network of monitoring nodes
- Full browser, API, DNS, BGP, and traceroute tests
- Edge versus origin comparisons for cache and latency
- Multi CDN benchmarking and selection support
- Real user monitoring to match synthetic results
- SLA reporting and early incident detection for the internet layer
Commonly used by: global retail, streaming platforms, travel, service providers
Pricing note: Catchpoint is best treated as a points-based internet performance budget. It is strongest when outside-in CDN, DNS, RUM, and synthetic monitoring justify the spend.
5. ThousandEyes
ThousandEyes draws the hop by hop path between user and app like a clean river map. When there is packet loss or a bad peer along the way, you can point to the exact bend in the river. That turns guesswork into action.
It blends application checks with network measurements, plus DNS and BGP views.
You can deploy agents in the cloud and within your own network, then stitch the story together during outages or slowdowns.
Features
- Path visualization that traces the full network route
- Cloud agents across many cities and enterprise agents on site
- Page load, HTTP, and transaction checks with network metrics
- DNS and BGP monitoring to expose routing problems
- Edge diagnostics to confirm cache behavior by region
- Shareable visual evidence for faster provider escalations
Commonly used by: financial services, SaaS, carriers, enterprise IT
Pricing note: ThousandEyes uses test units based on the number, type, and frequency of monitoring tests, so size your monthly unit budget carefully.
6. Coralogix
Coralogix treats logs like a fast moving stream. It turns the parts you query often into metrics, keeps the rest affordable, and still lets you search it later. If CDN traffic floods your budget, this approach feels like opening smart spillways.
You can watch WAF signals, bot patterns, and surge errors in real time, then page only when behavior gets weird. For teams who live in logs and care about spend control, it is a strong fit.
Features
- In stream analysis so you alert without heavy indexing
- Pipeline policies to route data by value and cost
- Events to metrics to keep key KPIs hot and light
- Direct queries over archived data in object storage
- Behavior based alerts for spikes and anomalies
- Cross stack correlation to tie edge, app, and security events
Commonly used by: eCommerce, ad tech, media, gaming
Pricing note: Coralogix is strong for high-volume edge observability because usage is shaped by logs, metrics, traces, and pipeline choices rather than simple seat counts.
{{promo}}
How Data Observability Tools Differ
You might already run data observability tools across pipelines and warehouses. The ideas carry over. You track freshness, volume, and schema drift to protect analytics. With CDN delivery you track latency, cache hit ratios, routing health, and error patterns to protect user experience.
When:
- You want one place to see everything and move fast in incidents: start with Datadog or Dynatrace. They give you full stack views and strong correlation.
- You must validate internet health and hold vendors to SLAs: add Catchpoint or ThousandEyes. Outside in truth wins tense calls.
- Your CDN logs are huge and growing: anchor on Coralogix, or pair it with your main tool to keep costs in check.
- Your teams are developer led and want simple setup: New Relic with quickstarts gets you up fast.
So while we are talking about CDN observability platforms here, your bigger ecosystem of data observability platforms matters. Shared alert channels, shared runbooks, and shared postmortems shorten recovery. Think of it as one wider practice where your edge is just another vital dataset.
Conclusion
Start small. Pick a narrow slice such as your checkout path or your home page. Wire synthetic checks from two regions, enable browser monitoring on that page, stream edge logs for only that route, and add one or two alerts that map to a real on call. In a week you will have clear wins to show your team.
Then widen the scope with care. Pull in DNS, add a second CDN if you run a multi-vendor, and write two crisp runbooks. Keep the English simple in those docs so anyone on call can act. Your goal is daylight during stressful nights.
FAQs
How can CDN observability minimize downtime and incidents?
CDN observability minimizes downtime by catching weak signals early. Synthetic tests from two or more regions spot outages before users do. RUM shows real impact by device and ISP. Edge logs expose spikes in errors or cache misses. Routed alerts trigger runbooks and traffic failover fast.
Are CDN observability platforms suitable for multi-CDN setups?
Yes. CDN observability platforms compare providers by region, run health checks, and validate failover. You steer traffic with DNS or a traffic manager, then watch hit ratio and TTFB while you shift. During incidents, third party data proves which CDN is weak so you can shed load quickly.
Can CDN monitoring platforms improve website load speed?
CDN monitoring platforms help speed by finding slow PoP mapping, cold caches, heavy images, and chatty endpoints. Then you tune TTLs, push the right cache headers, compress assets, and move work to the edge. The cycle is measure, change, re measure until user waits drop.
How do CDN observability tools detect and report incidents?
CDN observability tools detect incidents by watching synthetic tests, RUM beacons, and edge logs for unusual patterns. When errors or latency jump, anomaly rules fire and route alerts to chat or on call tools. Good setups attach tags, timelines, and snapshots so your responder sees cause and scope fast.
How do you set meaningful alerting thresholds in a CDN observability platform without creating alert fatigue?
Start with user impact, not raw noise. Baseline each route, region, CDN, and device type for one or two weeks. Alert on sustained changes that hurt SLOs, such as regional 5xx spikes, p95 TTFB jumps, or cache hit ratio drops. Send warnings to chat, but reserve pages for customer-impacting incidents.
What is the difference between CDN observability and standard application performance monitoring?
Application performance monitoring focuses on app code, services, databases, infrastructure, and traces. CDN observability watches the delivery layer between the origin and user, including edge PoP selection, cache behavior, DNS, routing, TLS, and ISP performance. The best setup connects both, so teams can see whether the app, origin, CDN, or network caused the slowdown.
How do you use CDN observability data to make the case for switching or adding a CDN provider?
Use side-by-side evidence. Compare TTFB, cache hit ratio, errors, uptime, failover time, and cost by region across your current and candidate CDNs. Add real user monitoring tools to show business impact by geography or device. Then present incident timelines showing where a second CDN or smarter routing would reduce risk.